Chapter 9 Instrumental Variables
9.1 Libraries
library(AER)      # ivreg command
library(ivpack)   # robust and clustered standard errors
library(dplyr)    # data manipulation
library(ggplot2)  # graphs
library(tibble)   # nice dataframes
library(haven)    # dta files
library(stargazer)# tables
library(sandwich) # robust se
library(lmtest)   # for print robust
9.2 Functions We Might Want to Have
# function to compute robust standard errors for lm
compute_lm_rse = function(lmodel) {
  vcov = vcovHC(lmodel, "HC1")
  se = sqrt(diag(vcov))
}

# function to easily pass lm results to stargazer
lm_robust = function(lm_formula, data) {
  lm_result = lm(lm_formula, data)
  lm_se = compute_lm_rse(lm_result)
  return(list("result" = lm_result, "rse" = lm_se))
}

# summary of OLS with robust standard errors
print_lm_robust = function(lmodel){
  results_robust = coeftest(lmodel, vcov = vcovHC(lmodel, "HC1"))
  print(results_robust)
}
9.3 A Brief Review of OLS: Replicating Table 2
ajr_world = read_dta("data/ajr/maketable2/maketable2.dta") %>%
  mutate(baseco = if_else(is.na(baseco), 0, 1)) %>%
  mutate(africa = factor(africa),
         asia = factor(asia),
         other = factor(other))

ajr_base = ajr_world %>%
  filter(baseco == 1)
lm_1 = lm_robust(logpgp95 ~ avexpr, data = ajr_world)
lm_2 = lm_robust(logpgp95 ~ avexpr, data = ajr_base)
lm_3 = lm_robust(logpgp95 ~ avexpr + lat_abst, data = ajr_world)
lm_4 = lm_robust(logpgp95 ~ avexpr + lat_abst, data = ajr_base)
lm_5 = lm_robust(logpgp95 ~ avexpr + lat_abst + africa + asia + other,
data = ajr_world)
lm_6 = lm_robust(logpgp95 ~ avexpr + lat_abst + africa + asia + other,
data = ajr_base)stargazer(lm_1$result, lm_2$result, lm_3$result, lm_4$result, lm_5$result, lm_6$result,
type = 'latex',
dep.var.labels = "Log GDP per Capita in 1995",
covariate.labels = c("Expropriation Risk", "Latitude", "Africa", "Asia", "Other", "Constant"),
omit.stat = c('f', 'ser'),
se = list(lm_1$rse, lm_2$rse, lm_3$rse, lm_4$rse, lm_5$rse, lm_6$rse),
title = "OLS Results")9.4 A Brief Review of Making Figures: Replicating Figure 2
ggplot(ajr_base, aes(x = avexpr, y = logpgp95)) +
  geom_text(aes(label = shortnam), hjust = 0, vjust = 0, size = 3) +
  geom_smooth(method = "lm", color = "Black", size = 0.5) +
  labs(x = "Average Expropriation Risk 1985-95",
       y = "Log GDP per Capita, 1995") +
  theme_bw()
## `geom_smooth()` using formula 'y ~ x'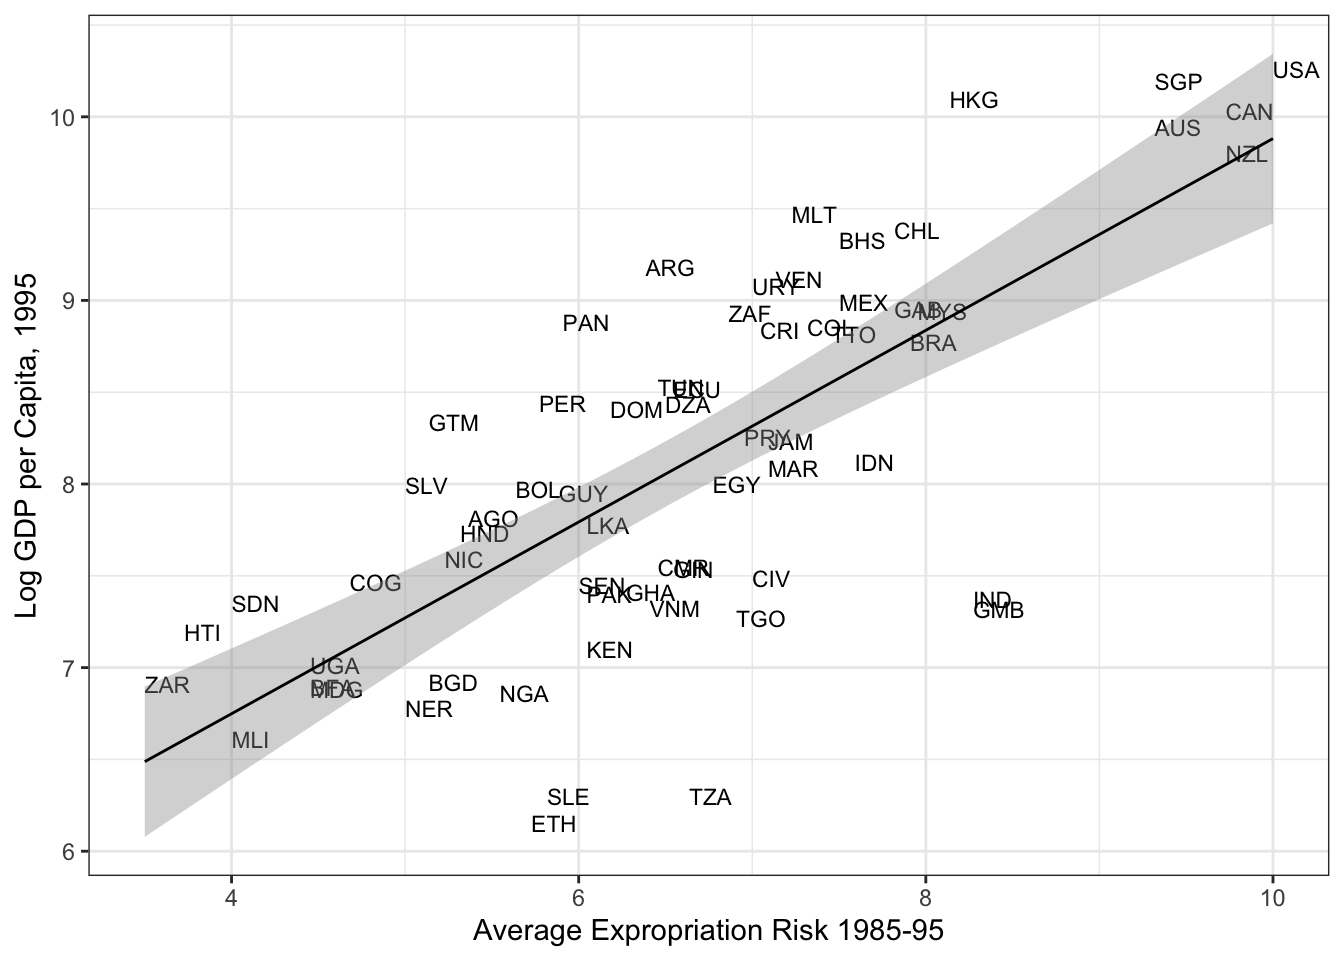
9.5 IV: Replicating Table 4
9.5.1 Loading the data
ajr_world = read_dta("data/ajr/maketable4/maketable4.dta") %>%
  mutate(rich4 = factor(rich4))
ajr_base = ajr_world %>%
  filter(baseco == 1)
9.5.2 Doing it by hand…
# first stage
iv_1_fs = lm(avexpr ~ logem4, ajr_base)
print_lm_robust(iv_1_fs)
##
## t test of coefficients:
##
## Estimate Std. Error t value Pr(>|t|)
## (Intercept) 9.34141 0.70429 13.2635 < 2.2e-16 ***
## logem4 -0.60678 0.15020 -4.0399 0.0001499 ***
## ---
## Signif. codes: 0 '***' 0.001 '**' 0.01 '*' 0.05 '.' 0.1 ' ' 1# add predicted variable to the dataset
ajr_base = ajr_base %>%
mutate(avexpr_pred = iv_1_fs$fitted.values)
# second stage
iv_2_ss = lm(logpgp95 ~ avexpr_pred, ajr_base)
print_lm_robust(iv_2_ss)##
## t test of coefficients:
##
## Estimate Std. Error t value Pr(>|t|)
## (Intercept) 1.90967 0.75692 2.5229 0.01422 *
## avexpr_pred 0.94428 0.12026 7.8522 7.142e-11 ***
## ---
## Signif. codes: 0 '***' 0.001 '**' 0.01 '*' 0.05 '.' 0.1 ' ' 1Note that the robust standard errors are still not correct, because we did not account for the 2SLS standard error correction. The next command will do all of this for us.
9.5.3 The ivreg Command
iv_1 = ivreg(logpgp95 ~ avexpr | logem4, data = ajr_base)
summary(iv_1)
##
## Call:
## ivreg(formula = logpgp95 ~ avexpr | logem4, data = ajr_base)
##
## Residuals:
## Min 1Q Median 3Q Max
## -2.44903 -0.56242 0.07311 0.69564 1.71752
##
## Coefficients:
## Estimate Std. Error t value Pr(>|t|)
## (Intercept) 1.9097 1.0267 1.860 0.0676 .
## avexpr 0.9443 0.1565 6.033 9.8e-08 ***
## ---
## Signif. codes: 0 '***' 0.001 '**' 0.01 '*' 0.05 '.' 0.1 ' ' 1
##
## Residual standard error: 0.9483 on 62 degrees of freedom
## Multiple R-Squared: 0.187, Adjusted R-squared: 0.1739
## Wald test: 36.39 on 1 and 62 DF, p-value: 9.799e-08If we want to use robust or clustered standard errors, we can use the functionalities from the ivpack.
# print robust standard errors
robust.se(iv_1)
## [1] "Robust Standard Errors"##
## t test of coefficients:
##
## Estimate Std. Error t value Pr(>|t|)
## (Intercept) 1.90967 1.17395 1.6267 0.1089
## avexpr 0.94428 0.17610 5.3623 1.289e-06 ***
## ---
## Signif. codes: 0 '***' 0.001 '**' 0.01 '*' 0.05 '.' 0.1 ' ' 1Again, we can write a wrapper function that gives us both the model as well as the robust standard errors so that we can easily pass them to stargazer. Unfortunately, it is not perfect yet, because it also prints out some stuff.
# function to easily pass robust iv results to stargazer
iv_robust = function(iv_formula, data_iv) {
  iv_result = ivreg(formula = iv_formula, data = data_iv)
  iv_rse = robust.se(iv_result)[, 2]
  return(list("result" = iv_result, "rse" = iv_rse))
}
OK, now let’s replicate table 4.
iv_1 = iv_robust(logpgp95 ~ avexpr | logem4, ajr_base)## [1] "Robust Standard Errors"iv_2 = iv_robust(logpgp95 ~ avexpr + lat_abst | logem4 + lat_abst, ajr_base)## [1] "Robust Standard Errors"ajr_noneo = ajr_base %>%
filter(!rich4 == 1)
iv_3 = iv_robust(logpgp95 ~ avexpr | logem4, ajr_noneo)## [1] "Robust Standard Errors"iv_4 = iv_robust(logpgp95 ~ avexpr + lat_abst | logem4 + lat_abst, ajr_noneo)## [1] "Robust Standard Errors"stargazer(iv_1$result, iv_2$result, iv_3$result, iv_4$result,
se = list(iv_1$rse, iv_2$rse, iv_3$rse, iv_4$rse),
dep.var.labels = "Log GDP in 1995",
covariate.labels = c("Expropriation Risk", "Latitude", "Constant"),
omit.stat = "ser",
title = "Instrumental Variable Results",
type = "latex")9.6 Adding Statistics to Stargazer
So far, we have not talked at all about additional test statistics. To look at those for our first specification, we can do this as follows:
# generate value of robust f-test
iv_1_fs = lm_robust(avexpr ~ logem4, ajr_base)
iv_1_fs_null = lm_robust(avexpr ~ 1, ajr_base)
f_iv_1 = waldtest(iv_1_fs$result, iv_1_fs_null$result,
                  vcov = vcovHC(iv_1_fs$result, type="HC1"))$F[2]
## Error in waldtest(iv_1_fs$result, iv_1_fs_null$result, vcov = vcovHC(iv_1_fs$result, : unused argument (vcov = vcovHC(iv_1_fs$result, type = "HC1"))stargazer(iv_1_fs$result,
se = list(iv_1_fs$rse),
add.lines = list(c("Robust F", format(round(f_iv_1, 2), nsmall = 2))),
dep.var.labels = "Expropriation Risk",
covariate.labels = c("Log of Settler Mortality", "Constant"),
title = "First Stage",
omit.stat = c("ser", "f"),
type = "latex")## Error in h(simpleError(msg, call)): error in evaluating the argument 'x' in selecting a method for function 'format': object 'f_iv_1' not found